Datei:Nearby Stars (14ly Radius).svg

Originaldatei (SVG-Datei, Basisgröße: 600 × 600 Pixel, Dateigröße: 92 KB)
![]()
Diese Datei und die Informationen unter dem roten Trennstrich werden aus dem zentralen Medienarchiv Wikimedia Commons eingebunden.
| BeschreibungNearby Stars (14ly Radius).svg |
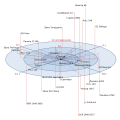
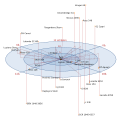
English: A spatial representation of every star within 14 light-years of Sol. There are 32 known stars in this region, including Sol. The stars are coloured according to the spectral type, which may not reflect the actual colour. Please see this Wikipedia article for the listing of stars. If a star is double or triple the stars are shown stacked vertically: the actual position is the star closest to the centre plane. The stars on this map may not all be visible to the naked eye, as many are dwarf stars. Some of this information may be preliminary and not entirely accurate as a result.
The coordinate system is right ascension and declination. Hours of RA are marked, as well as distance in multiples of 5 light-years. |
|||
| Datum | ||||
| Quelle |
self-made, Mathematica, Inkscape. See also: http://www.daviddarling.info/encyclopedia/S/starsnearest.html |
|||
| Urheber | Inductiveload | |||
| Genehmigung (Weiternutzung dieser Datei) |
|
|||
| Andere Versionen |
|
|||
| SVG‑Erstellung InfoField |
|
Mathematica Code
raToTheta[{h_, m_, s_}] := 15*h + 15/60*m + 15/3600*s;
decToPhi[{d_, m_, s_}] := 90 - (d + (m/60 + s/3600)*Sign[d]);

(*Returns celestial RA and Dec as radians in spherical coords*)
celestialToSph[{{rah_, ram_, ras_}, {dd_, dm_, ds_}, dist_, name_}] :=
  {
   raToTheta[{rah, ram, ras}] Degree,
   decToPhi[{dd, dm, ds}] Degree,
   dist
   };

(*Map Spherical coords to Cartesian*)
sphereMap[{phi_, theta_, r_}] :=
  {
   r*Sin[theta] Cos[phi],
   r*Sin[theta] Sin[phi],
   r*Cos[theta]};

(*Produce a circle of radius r offset in the z axis by z*)
offsetCircle[r_, z_] := ParametricPlot3D[
   {r*Cos[t],
    r*Sin[t],
    z},
   {t, 0, 2 Pi}];

(*Star list as {RA},{Dec},Distance,Name}*)
starList =
  {
   {{0, 0, 0}, {0, 0, 0}, 0, "Sun"},
   {{14, 29, 43}, {-62, 40, 46}, 4.2421, "Proxima Centauri"},
   {{14, 39, 36.5}, {-60, 50, 02}, 4.3650, "\[Alpha] Centauri"},
   {{17, 39, 35.1}, {4, 41, 36}, 5.9630, "Barnard's Star"},
   {{10, 49, 18.7}, {-53, 19, 10}, 6.5880, "Luhman 16"},
   {{10, 56, 29.2}, {7, 0, 53}, 7.7825, "Wolf 359"},
   {{11, 3, 20.2}, {35, 58, 12}, 8.2905, "Lalande 21185"},
   {{6, 45, 8.8}, {-16, 42, 58}, 8.5828, "Sirius"},
   {{1, 39, 1.3}, {-17, 57, 01}, 8.7280, "Luyten 726-8"},
   {{15, 41, 51.5}, {-22, 50, 25}, 9.3000, "Wise 1541-2250"},
   {{18, 49, 49.4}, {-23, 50, 10}, 9.6183, "Ross 154"},
   {{23, 41, 54.7}, {44, 10, 30}, 10.322, "Ross 248"},
   {{3, 32, 55.8}, {-9, 27, 30}, 10.522, "\[Epsilon] Eridani"},
   {{23, 5, 52}, {-35, 51, 11}, 10.742, "Lacaille 9352"},
   {{11, 47, 44.4}, {0, 48, 16}, 10.919, "Ross 128"},
   {{22, 38, 33.4}, {-15, 18, 7}, 11.266, "EZ Aquarii"},
   {{07, 39, 18.1}, {5, 13, 30}, 11.402, "Procyon"},
   {{21, 06, 53.9}, {38, 44, 58}, 11.403, "61 Cygni"},
   {{18, 42, 46.7}, {59, 37, 49}, 11.525, "Struve 2398"},
   {{1, 18, 22.9}, {44, 1, 23}, 11.624, "Groombridge 34"},
   {{22, 3, 21.7}, {-56, 47, 10}, 11.824, "\[Epsilon] Indi"},
   {{8, 29, 49.5}, {26, 46, 37}, 11.826, "DX Cancri"},
   {{1, 44, 4.1}, {-15, 56, 15}, 11.887, "\[Tau] Ceti"},
   {{3, 35, 59.7}, {-44, 30, 45}, 11.991, "GJ 1061"},
   {{1, 12, 30.6}, {-16, 59, 56}, 12.132, "YZ Ceti"},
   {{07, 27, 24.5}, {5, 13, 33}, 12.366, "Luyten's Star"},
   {{2, 53, 0.9}, {16, 52, 53}, 12.571, "Teegarden's Star"},
   {{18, 45, 5.3}, {-63, 57, 48}, 12.571, "SCR 1845-6357"},
   {{5, 11, 40.6}, {-45, 1, 6}, 12.777, "Kapteyn's Star"},
   {{21, 17, 15.3}, {-38, 52, 03}, 12.870, "Lacaille 8760"},
   {{22, 27, 59.5}, {57, 41, 45}, 13.149, "Kruger 60"},
   {{10, 48, 14.7}, {-39, 56, 06}, 13.167, "DEN 1048-3956"},
   {{6, 29, 23.4}, {-2, 48, 50}, 13.349, "Ross 614"}
     };

(*Get stars in {phi, theta, r} format*)
starsDeg = Map[celestialToSph, starList, 1];
(*Map into the Cartesian space*)
starPlot = sphereMap /@ starsDeg;
stars = ListPointPlot3D[starPlot];
labels = Table[
   Graphics3D[
    Text[
     starList[[i, 4]],
     starPlot[[i]],
     {-1.1, 0}
     ]],
   {i, 1, Length[starList]}];
posLines = Table[
   Graphics3D[{Orange,
     Line[
      {{0, 0, 0},
       {starPlot[[i, 1]], starPlot[[i, 2]], 0},
       starPlot[[i]]}
      ]}],
   {i, 2, Length[starList]}];
gridhours = Graphics3D[
   {Line[{{-20, 0, 0}, {20, 0, 0}}],
    Line[{{0, -20, 0}, {0, 20, 0}}]}];
gridly = {offsetCircle[5, 0],
   offsetCircle[10, 0],
   offsetCircle[15, 0]};
viewDist = 20000; (*Distance of Viewpoint*)
viewRA = 225 Degree; (*RA of viewpoint*)
viewDec = 20 Degree;(*Dec of viewpoint*)
Show[
 labels,
 posLines,
 stars,
 gridhours,
 gridly,

 BaseStyle -> {FontFamily -> "DejaVu Sans"},
 PlotRange -> {{-15, 15}, {-15, 15}, {-12, 12}}
{{QualityImage}},
 SphericalRegion -> True,
 Axes -> False,
 BoxRatios -> {1, 1, 1},
 Boxed -> False,
(*ViewPoint -> {Sin[viewRA]*viewDist, Cos[viewRA]*viewDist,
   Sin[viewDec]*viewDist},*)
 (*ViewVertical -> {0, 0, 1},*)
 AxesLabel -> {"x", "y", "z"},
 ImageSize -> 1000]
Kurzbeschreibungen
Einige Werte ohne einen Wikidata-Eintrag
6. April 2008
Dateiversionen
Klicke auf einen Zeitpunkt, um diese Version zu laden.
| Version vom | Vorschaubild | Maße | Benutzer | Kommentar | |
|---|---|---|---|---|---|
| aktuell | 20:08, 6. Apr. 2008 |  | 600 × 600 (92 KB) | wikimediacommons>Inductiveload | {{Information |Description=A spatial representation of every star within 14 light-years of en:Sol. There are 32 stars in this region, including Sol. The stars are coloured according to the spectral type, which may not reflect the actual colour. Plea |
Dateiverwendung
Die folgenden 2 Seiten verwenden diese Datei:


