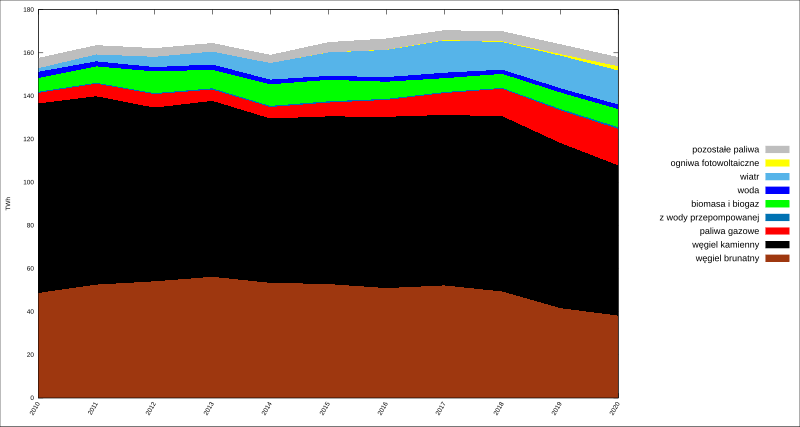
set terminal svg size 1500,800
set object 1 rectangle from screen 0,0 to screen 1,1 fillcolor rgb"white" behind
set output 'generation-mix.svg'

set key outside
set key right center
set key samplen 3 spacing 1 font ",17"

set xtics rotate by 60 right
set xtics 1

set ylabel "TWh"

set datafile separator ","

plot \
  "generation.csv" using 1:($2+$3+$4+$5+$6+$7+$8+$9+$10)/1000 title 'pozostałe paliwa' with filledcurves x1 lc rgb 'gray', \
  "generation.csv" using 1:($2+$3+$4+$5+$6+$7+$8+$9)/1000 title 'ogniwa fotowoltaiczne' with filledcurves x1 lc rgb 'yellow', \
  "generation.csv" using 1:($2+$3+$4+$5+$6+$7+$8)/1000 title 'wiatr' with filledcurves x1, \
  "generation.csv" using 1:($2+$3+$4+$5+$6+$7)/1000 title 'woda' with filledcurves x1 lc rgb 'blue', \
  "generation.csv" using 1:($2+$3+$4+$5+$6)/1000 title 'biomasa i biogaz' with filledcurves x1  lc rgb 'green', \
  "generation.csv" using 1:($2+$3+$4+$5)/1000 title 'z wody przepompowanej' with filledcurves x1, \
  "generation.csv" using 1:($2+$3+$4)/1000 title 'paliwa gazowe' with filledcurves x1 lc rgb 'red', \
  "generation.csv" using 1:($2+$3)/1000 title 'węgiel kamienny' with filledcurves x1 lc rgb 'black', \
  "generation.csv" using 1:($3)/1000 title 'węgiel brunatny' with filledcurves x1 lc rgb '#9e370f',
"rok","węgiel kamienny","węgiel brunatny","paliwa gazowe","z wody przepompowanej","biomasa i biogaz","woda","wiatr","ogniwa fotowoltaiczne","pozostałe paliwa"
2010,87863,48651,4890,568,6305,2920,1664,0,4797
2011,87326,52529,5821,430,7601,2331,3205,0,4305
2012,80528,54054,6259,428,10094,2037,4747,1,3991
2013,81568,56150,5247,558,8622,2439,6004,1,3968
2014,76162,53365,5329,551,9976,2182,7676,7,3810
2015,77693,52825,6405,603,9932,1832,10858,57,4739
2016,79400,50920,7831,482,7957,2139,12588,124,5193
2017,79022,52166,10141,474,6416,2560,14909,165,4613
2018,81257,49331,12709,417,6511,1970,12799,300,4745
2019,76538,41639,15131,706,7602,1958,15107,711,4597
2020,69668,38148,16891,819,8371,2118,15800,1958,4270

