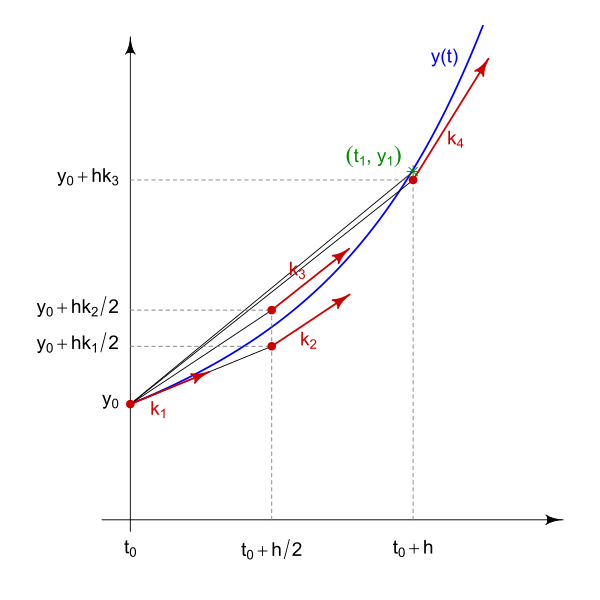
f <- function(t, y) y + t^3
y_exact <- function(t) 7*exp(t) - t^3 - 3*t^2 - 6*t - 6

t <- 0
y <- 1
h <- 1
h2 <- 0.5*h
K1 <- f(t, y)
K2 <- f(t + 0.5*h, y + h2*K1)
K3 <- f(t + 0.5*h, y + h2*K2)
K4 <- f(t + h, y + h*K3)
Phi <- 1/6*(K1 + 2*(K2+K3) + K4)

library(shape)

svg(point=16)
oldpar <- par(mar=c(1.1,1.1,1.1,1.1))
plot(c(-0.3, 1.5), c(-0.3, 4.1), type="n", axes=FALSE, ann=FALSE)
curve(y_exact, 0, 1.5,  col="blue", lwd=2, add=TRUE)
Arrows(-0.1, 0, 1.5, 0)
Arrows(0, -0.1, 0, 4.1)
arr.x0 <- c(0, h2, h2, h)
arr.y0 <- c(y, y+h2*K1, y+h2*K2, y+h*K3)
arr.x1 <- arr.x0 + h/4
arr.y1 <- arr.y0 + h/4*c(K1, K2, K3, K4)
segments(t, y, c(arr.x0, h), c(arr.y0, y + h*Phi))
segments(c(h2,h), 0, c(h2,h), arr.y0[3:4], lty=2, col="grey50")
segments(0, arr.y0[2:4], c(h2, h2,h), arr.y0[2:4], lty=2, col="grey50")
Arrows(arr.x0, arr.y0, arr.x1, arr.y1, col="red3", lwd=2)
points(arr.x0, arr.y0, col="red3", pch=16)
text(c(0, h2, h), -0.1, c(expression(t[0]), expression(t[0]+h/2), expression(t[0]+h)), pos=1)
text(0, arr.y0 , c(expression(y[0]), expression(y[0]+h*k[1]/2),
   expression(y[0]+h*k[2]/2), expression(y[0] + h*k[3])), pos=2)
text(arr.x0+c(0.1, 0.13, 0.09, 0.15), arr.y0+c(0.1,0.2,0.17,0.5),
   c(expression(k[1]), expression(k[2]), expression(k[3]),
   expression(k[4])), pos=c(1,1,3,1), col="red3")
text(1.2, y_exact(1.2), "y(t)", col="blue", pos=2)
points(h, y + h*Phi, col="green4", pch=8)
text(h, y + h*Phi+0.1, expression((paste(t[1],", ",y[1]))), col="green4", pos=2)
par(oldpar)
dev.off()

