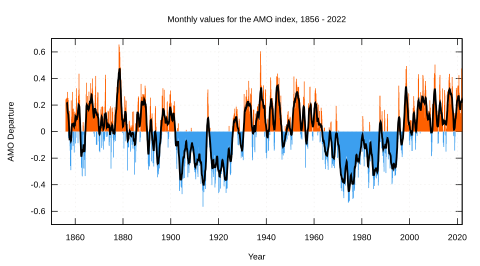
Benutzer:Marsupilami/Gnuplot/Amo timeseries 1856-present
aus Wikipedia, der freien Enzyklopädie
Die Software-Voraussetzungen zum wieder neu Erstellen von Datei:Amo timeseries 1856-present.svg sind:
- Gnuplot in Version 4.2
- bash (Bourne-again shell) ab Version 3
- bc (Basic Calculator)
Die aktuellen Daten sind als Datei amon.us.long.data zu speichern.
Das folgende bash-Script zum Aufbereiten der Daten ist als format.sh zu speichern und mit chmod u+x format.sh ausführbar zu machen. Das Script wird über ./format.sh aufgerufen und läuft ca. ein bis zwei Minuten. Dabei generiert es im aktuellen Verzeichnis vier temporäre Dateien, wovon drei von Gnuplot weiterverwendet werden.
#!/bin/bash
# Author: Marsupilami

input="amon.us.long.data"

# temp files
output="${input}.tmp1"
positive="${input}.tmp2"
negative="${input}.tmp3"
average="${input}.tmp4"


# format
grep "^ [0-9]" "$input" |\
        while read X; do
                X=($X)
                for I in {1..12}; do
                        let J=I*8
                        printf -v J %02d $J     # leading zero
                        echo ${X[0]}.${J} ${X[$I]}
                done
        done > "$output"


# positive values
grep -v " -" "$output" > "$positive"


# negative values
grep " -" "$output" > "$negative"


# fill array for moving average
COUNTER=0
while read X; do
        X=($X)
        VALUE[$COUNTER]=${X[1]}
        let COUNTER++
done < "$output"


# moving average
RANGE=12
START_IGNORE=5
let END=COUNTER-START_IGNORE-1
COUNTER=0

while read X; do
        X=($X)
        if [ $COUNTER -ge $START_IGNORE ] && [ $COUNTER -lt $END ]; then
                A=0
                for ((I=$COUNTER-$START_IGNORE; I<$COUNTER+$RANGE-$START_IGNORE; I++))
                do
                        A=$(echo "$A + ${VALUE[$I]} / $RANGE" | bc -l)
                done
                echo ${X[0]} $A
        fi
        let COUNTER++
done < "$output" > "$average"
Das folgende Gnuplot-Script ist als generate.gnu zu speichern und kann zum Generieren der SVG-Datei über gnuplot generate.gnu aufgerufen werden. Die generierte SVG-Datei heißt graph.svg und liegt auch im lokalen Verzeichnis.
set title 'Monthly values for the AMO index, 1856 -2009'
set xlabel 'Year'
set ylabel 'AMO Departure'

set yrange [-0.7:0.7]
set xrange [1850:2015]

set grid linetype rgb "#e9e7e2"

set terminal svg size 672,372
set output 'graph.svg'

plot    'amon.us.long.data.tmp2' notitle with impulses lt rgb "#fe6000", \
        'amon.us.long.data.tmp3' notitle with impulses lt rgb "#3c9fef", \
        'amon.us.long.data.tmp4' notitle with lines lw 2.5 lt rgb "#000000"
